


IFPRI has adhered to the principles of Open Access since its inception. All IFPRI publications are freely available through the e-Brary Open Knowledge Repository and the IFPRI Dataverse, housing over 6,800 publications and datasets.
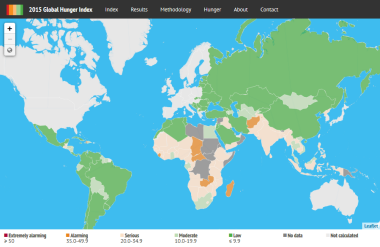
In honor of International Open Access Week 2015, IFPRI is proud to highlight the data and tools used to provide the 2015 Global Hunger Index (GHI) as Open Access. The GHI report, now in its 10th year, presents a multidimensional measure of national, regional, and global hunger by combining four component indicators into a single index: undernourishment, child mortality, child wasting and child stunting. The last two indicators- child wasting and child stunting- replace the indicator of proportion of underweight children used in previous GHI calculations.
The underlying data behind each of the 117 countries covered in the 2015 GHI is available for download as tabulated data and Linked Open Data, available through the IFPRI data portal. Moreover, users now are able to query and connect to the GHI data using a SPARQL endpoint.
Another exciting new tool offered as part of the 2015 GHI is an open source, interactive web/mobile app (see source code for GHI data app). The GHI app presents an interactive map visualization alongside country GHI scores and related data from previous years. Users can browse the data in interactive fashion via their web browsers or mobile devices, and the app also can be embedded in third-party sites to allow for enhanced visibility.
Finally, data from the 2015 GHI also have been uploaded to Tableau for enhanced data visualization and sharing purposes. This year’s GHI data visualization using Tableau features a key figures from the 2015 GHI as well as a detailed description of how the GHI scores are calculated, used together to tell the story of hunger around the world (see embedded interactive version below).